Jupyter Notebook Tips

This is an unpolished post with some basic ideas. Hopefully the next time I think of a tip to share, I'll remember this post and put it here.

  • Single question mark - documentation
  • Double question mark - source code (doesn't work for code written in C)
  • Create a new Jupyter Kernel:
    source activate MYENV && echo y | conda install ipykernel && python -m ipykernel install --user --name NAME_FOR_kernelspec --display-name "Python (MYENV)"
  • Cell magics, especially %%bash, %%html, %%javascript, %%prun, %%time, %debug

Information Representation, Understanding, Mnemonics, Information Compression

My brother got me these little notebooks - FIELD NOTES (website). Inside the package with the notebooks came a tiny promotional/marketing slip. It says something that resounds with me - "I'm not writing it down to remember it later, I'm writing it down to remember it now." I kept the tiny promotional slip due to that quote, because it seems to follow a central theme in the way human brains work and a big part of the reason I have a blog: you remember things better when you write (or draw) them down.

Here are some thoughts on the subject.

What writing is:

  • Internal representation: If you can encode your thoughts into either words or drawings, you know your thoughts better than if you can't
  • An encoding of your understanding/beliefs/knowledge at a given moment. It's an encoding because it depends on your knowledge - someone who can't read the language you're writing in can't understand it, and you may be writing things that even people who can read the language you write can't read. If you get amnesia, you might not even be able to understand your own notes.

Representations and other ideas:

  • Graphs: your brain can attach related ideas like in graphs (graphs as in nodes and edges, not as in graph paper), even in simple graphs like trees or DAGs. The more you already know about a topic, the easier it is to learn something new about it, because it fits as a new node on the graph, connected to one or more other nodes - it might be the case that the more nodes that new node can connect to, the easier it will be to remember it. For example, it's easier to remember that Sundar Pichai is the CEO of Google than it is to remember the name of a CEO you've never heard of belonging to a company you've never heard of.
  • Compression: the Aliens movie was pitched as "Jaws in space" - it shares a common structure with something that many people are already familiar with. The person who pitched the movie didn't have to go into a long explanation about the movie. They got the whole idea across in 3 words by using previous knowledge.
  • Mnemonics: it's easy to remember a simple sentence like "every good boy does fine" to remember that the musical staff goes "EGBDF". The Memory Book by Harry Lorayne and Jerry Lucas is designed to help you mnemonic-ize every bit of information by exploiting structure in information or converting it into a form that allows you to relate it to something you already know. Here is an example from their book, outlining the method of remembering names and faces:
    • "Most of us recognize faces (did you ever hear anyone say, 'Oh, I know your name, but I don't recognize your face'?). It's the names we have trouble with. Since we do usually recognize faces, the thing to do is apply a system wherein the face tells us the name. That is basically what our system accomplishes, if it is applied correctly."
    • The method first converts the name into something memorable. "...many names that already have meaning...immediately create pictures in your mind." (And there is a method of converting unmemorable names into memorable phrases)
    • Then find something memorable about their face
    • Then attach the two together, using methods first introduced earlier in the book.
  • Structure
    • We have schedule books so we can see how pieces of information relate to each other in time
      • In police television shows when they construct a timeline, they're taking information from different formats (e.g. free-form text) and re-organizing those pieces of information as they relate to each other through time. If the information were in a SQL database, then it would be as simple as "...WHERE date IS NOT NULL ... ORDER BY date"
    • When we first meet someone and add them to our address book (or digital equivalent), we parse out their information into first name, last name, phone, email, etc. Our contact lists aren't typically filled with unstructured text biographies with phone numbers and email addresses scattered around. Having the structure allows us to quickly look up specific pieces of information later - when you're providing someone's phone number to someone else, you don't scan through an entire biography to find their phone number: it's right there in the "phone number" field.
    • When pieces of related information are introduced by ignoring the common structure of those pieces and instead diving directly into the first one, it's more difficult to assimilate that knowledge than if the "meta" information was introduced first and the different pieces were compared/contrasted so that the information could be compressed and remembered more easily. An example was when I was taking statistics - we learned about the Bernoulli Distribution before really learning what a probability distribution was. I had difficulty remembering specific details about the distributions, like their formulas and applications, until I created a tabulation of the distributions and saw their applications and formulas side-by-side and saw how they were similar and different.
  • Even as I write this, I'm structuring the information as a tree - each main bullet point splits into bullet points that are related to their parent bullet, and the bullet points on the same level are related to each other in some way.

An interesting result: I can read articles about topics I'm familiar with more quickly than I can read articles about topics I'm not familiar with. For the former, I can often skim through as background knowledge I already know is repeated, but for the latter, I have to look things up as I reach things I'm not aware of.

Things I haven't figured out how to keep track of in an efficient format yet:

  • The things that are going on in the lives of people I care about. People usually have multiple threads going on in their lives, e.g. their relationships and their health. If I just write down some notes after speaking with someone and record a timestamp, then each of the person's life threads will be jumbled together with the other information in those notes. Without modifying the notes, to go back and read to understand an individual thread, it will be necessary to read unrelated notes about other threads. If the information were broken out into tabular form, then each note could be broken out into sub-notes that would each contain a field that indicates the relevant life thread; However, maybe there's a better way to structure that information.

What I like about computer programs compared to human language text:

  • A computer program or computer software is a computer-program-encoded set of instructions of steps to follow. Programmers have encoded their thoughts of how to convert inputs to outputs, into a format that a computer can read and execute.
  • If the output isn't as you expect, then you know you didn't encode your thoughts properly into that programming language. You can provide an input, run the program, and review the output to see if it's what you expected. If it's not what you expected, then you can review the steps of the program to find what went wrong. That's the purpose of unit testing - create a well-defined set of inputs and outputs and make sure that the program matches your expectation.
  • Reading free-form human-produced text takes more effort, because you have to have an understanding of the world and the state of that world before the text occurred, and then mentally execute the text-based "program" and mentally modify your internal representation of the state, or produce new states (e.g. when first being introduced to a branch of mathematics you've never been exposed to before), as the text progresses. Sentences that contain too much information are difficult to process because we may need to read the sentence multiple times or stop in the middle of a sentence in order to mentally break it down into units of understanding. Programs define the variables at the beginning, whereas human-written text doesn't usually introduce the world before it walks through the steps. If you write for people like you write for computers, then it may be easier for humans to follow your writing. (Although I recognize this blog post isn't exceptionally well-organized - I just had a bunch of ideas and wanted to get them out before I forgot.)

Chromatic App: Project Proposal: Approved

My project proposal for my "CS185c Machine Learning with Applications in Information Security" class project has been approved by Professor Mark Stamp. I am extremely excited to be pursuing this self-chosen project as part of a Machine Learning class at University with a master student as a teammate and oversight by a professor experienced in Machine Learning, as I have been wanting to re-create a technology effectively similar to that which backed the Prismatic News App ever since it shut down on . The (currently empty) GitHub repository for this project is at https://github.com/mica5/chromatic_news.

The project presentation is this coming Tuesday, October 2nd at 10:30am. The final project paper is due on Tuesday, November 27th. Yesterday I sent a list of article urls to my project teammate, and he said he will write an article downloader today and have details for me by this afternoon so I can continue working on it.

SJSU CS157A DBMS1 Dr. Lin 2018-08-28T

Go to the DB1 project page: http://xanadu.cs.sjsu.edu/~drtylin/classes/cs157A/Project/DB1/
Download and run the create_FIRST1a.rtf file http://xanadu.cs.sjsu.edu/~drtylin/classes/cs157A/Project/DB1/create_FIRST1a.rtf on your DB.
Then download and run "populate_FIRST1a .rtf" http://xanadu.cs.sjsu.edu/~drtylin/classes/cs157A/Project/DB1/populate_FIRST1a%20.rtf, the one that has a space in the name, because the one without a space in the name has "FIRST1a_ID_SEQ.nextval" in the queries, which the table creation file "create_FIRST1a.rtf" doesn't create.

Then execute these commands in turn and review the results:

select sum(salary) from first1a;
-- remember, this poor guy got cancer from the company's parts he was handling
delete from first1a where snum="s3" and pnum="p2";
select sum(salary) from first1a;

Dr. Lin said that this employee wanted time off but also should still be paid. I think the point he was trying to show here is that by removing him from the list of employees who are available to continue working in the company, because of the poor schema design, that he was also removed from sum(salary), so now we don't know how much the company is paying its employees because the database design can't properly represent that.

However, I believe Dr. Lin introduced a mistake when he used an aggregate function "sum(salary)", because each employee's salary is getting counted each time for the number of parts that employee handles. What we really want to do is see each employee's salary once, and then sum up the results.

See each employee's salary once:

select distinct snum,salary
    from first1a;
+------+--------+
| snum | salary |
+------+--------+
| S1   |  40000 |
| S2   |  30000 |
| S3   |  30000 |
| S4   |  40000 |
| S7   |  60000 |
+------+--------+

Then, from that table, select sum(salary):

select sum(salary)
    from (
        -- note that this is the query from above
        select distinct snum,salary
            from first1a
    ) table_alias_1;
+-------------+
| sum(salary) |
+-------------+
|      200000 |
+-------------+

What this shows is that you can not only select from tables in the database, but you can also select from the results of a select statement, which is called a subquery. Note that "table_alias_1" is just a necessary part of the MariaDB syntax - without naming it that, an error would appear: "ERROR 1248 (42000): Every derived table must have its own alias".

Note that the ") table_alias_1" could have just as easily read ") AS table_alias_1". "AS" is optional. However, table_alias_1 is not a very good name for the subquery. Sometimes it's difficult to think of a good name for a subquery so we end up naming them things like "step1", "step2", etc., but in this case, an apt name could be "employee_salaries" or "distinct_employee_salaries".

Connecting to MariaDB (especially in Python)

The Password File

First, set up your .my.cnf file: https://dev.mysql.com/doc/refman/8.0/en/option-files.html
Here is an example:

[client]
host=localhost
port=3306
user=mica
password='your user db password here'
database=db1

This file allows you to connect to the DB more easily. With it, all you have to type (assuming your db is on the same machine you're running commands from): "mysql db1". Without it, you would have to type: "mysql -u mica db1 -p" and then type your password at the prompt every time you want to connect. (Note that you should never type your password in plaintext on the command line using "-p=mypassword" or "--password=mypassword", because other processes on the computer can see what you typed in and steal your password. Use the .my.cnf file or use the "-p|--password" without an argument and type it in at the prompt where your password is hidden from view.)

Connecting to MariaDB in Python

Original webpage: https://mariadb.com/resources/blog/how-connect-python-programs-mariadb
MySQL-python client: https://pypi.org/project/MySQL-python/

If you have anaconda (see my post Jupyter Notebook Introduction and Basic Installation for installing anaconda):

# this creates an environment called "mariadb" that installs a library called "mysqlclient" using the channel "bioconda".
conda create -n mariadb -c bioconda mysqlclient

Otherwise, create a virtualenv by following this tutorial: https://packaging.python.org/guides/installing-using-pip-and-virtualenv/

# note that "~" is synonymous with your home folder, e.g. /Users/mica in mac or /home/mica in linux.
# on windows replace "~" with "YOUR_HOME_FOLDER", wherever your home folder is.

# create the environment.
virtualenv ~/python3

# activate the environment
source ~/python3/bin/activate

# confirm that the environment is active.
which pip
# should return something like ~/python3/bin/pip

# follow the pip command as mentioned by the link mentioned above:
pip install MySQL-python

Finally, some python code to confirm that the installation is working:

Additional Notes

This demonstrates proper use of query parameters. It properly formats the data types for the query (e.g. dates/integers/strings/etc.), and is also the proper use in production code for preventing injection attacks:

cursor.execute(
    'select * from companies where SNUM=%(snum)s',
    params={
        'snum': 'S1',
    },
)

Introduction to the Command Line

My hope for this post is to lower the barrier to entry for using the shell for people who are otherwise overwhelmed by not knowing where to begin. I will outline a series of commands that will allow you to become comfortable with the basics of the command line on unix/linux/Mac and learn enough to be able to explore and learn more about it on your own (think of this as your launchpad). Read more Introduction to the Command Line

Study Progress

Abbreviations:
ISLR: Introduction to Statistical Learning with Applications in R by Gareth James, Daniela Witten, Trevor Hastie, and Robert Tibshirani, ISBN 978-1-4614-7137-0
Hands-on: Hands-On Machine Learning with Scikit-Learn & TensorFlow by Aurélien Géron, ISBN 978-1-491-96229-9

2018-08-08
Created my first database replication server, a Postgres replication server from server to laptop following book "PostgreSQL Replication" by Hans-Jürgen Schönig and Zoltan Böszörmenyi.

2018-06-27
Wrote an API using python, falcon, and psycopg2 for storing data from garage sensors into a postgresql database.

2018-06-26T
Build LSTM using Keras on TensorFlow for predicting the number of parking spaces available in each parking garage.

2018-06-24U
On parking garage data, added circular statistics to hour of the day and day of the year, and increased accuracy on generalized linear model by 1% from 77% to 78% using h2o Flow. Started learning the basics of TensorFlow, computational graphs, constants/variables/placeholders, sessions.
Reading Hands-on, chapters 2 (data processing, scikit-learn pipelines), 9 (intro to TensorFlow), and 14 (RNNs and LSTMs).

2018-06-19T
SpotMe, viewing and cleaning parking garage data so that it can be used to train a machine learning model. Learned about a tool called h2o.ai.

2018-06-13W
Started working for SJSU student-led startup SpotMe Solutions.

2018-06-12T
ISLR Chapter 4 Logistic Regression (page 136).
Handson-ML Chapter 2 End-to-End Machine Learning Project (page 49).

Potential resources:
Things on my links page (https://violeteldridge.com/links/).
https://www.deeplearning.ai/ (Deep Learning Coursera Specialization by Andrew Ng).

San Jose Parking Garage Data


The color scheme follows the same as described in https://violeteldridge.com/2017/11/09/raspberry-pi-plot-of-temperature-humidity-pressure-data/. Roy.G.Biv. (rainbow) with red as today, orange as yesterday, yellow as the day before that, etc.

It can be seen that the parking garage is EXTREMELY FULL, which is due to Fanime in the San Jose Convention Center this Memorial Day Weekend.

Conversely, see this graph, which clearly serves a business district (or otherwise people who work on weekdays):

It's completely empty today, Saturday! And the schedule of the weekdays are quite regular, with slightly less cars throughout the day on Friday but still following the general day pattern of the other two recorded weekdays.

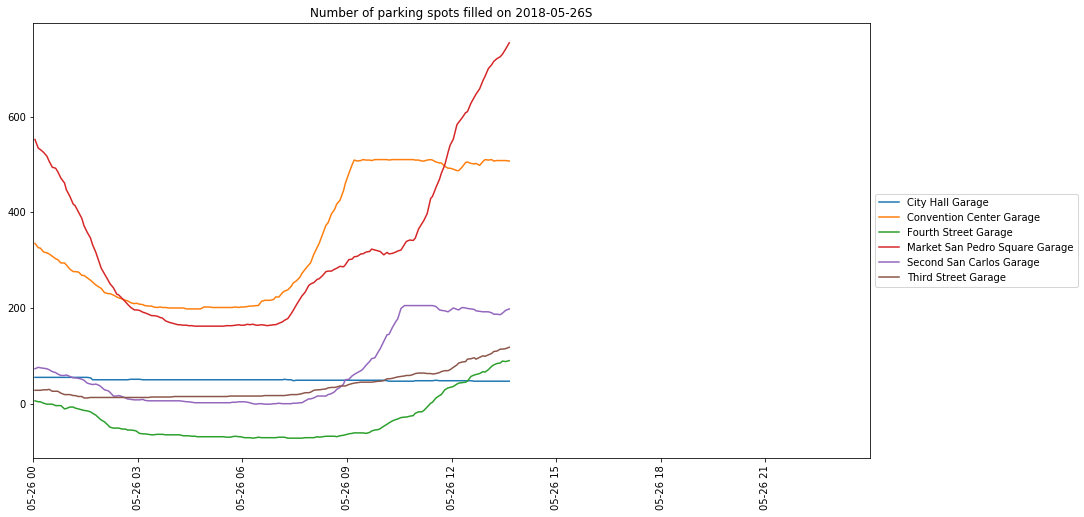
Here, you can see that first the Convention Center Garage filled (notice the plateau), then the Second San Carlos Garage filled, and now people are working on filling the Market San Pedro Square Garage! (However, also note that Fourth Street Garage is reporting usage of a negative number of parking spaces. Since the API returns the number of spaces available in the garage, the data shown here are the number of spaces available in the garage subtracted from the total available capacity of the garage. So this probably means they under-counted the total capacity of the garage, or reported a number of available spaces greater than actual total number of spaces available in the garage.)
I started recording San Jose parking garage data on 2018-05-22. This data is publicly available for free from https://data.sanjoseca.gov/developers/. Here is an example of what the data looks like (json format):

{
    "page": "1",
    "rows": [
        {
            "cell": [
                "Fourth Street Garage",
                "Open",
                "324",
                "350"
            ],
            "id": "4"
        },
        {
            "cell": [
                "City Hall Garage",
                "Open",
                "255",
                "302"
            ],
            "id": "8"
        },
        {
            "cell": [
                "Third Street Garage",
                "Open",
                "142",
                "146"
            ],
            "id": "12"
        },
        {
            "cell": [
                "Market San Pedro Square Garage",
                "Open",
                "349",
                "425"
            ],
            "id": "16"
        },
        {
            "cell": [
                "Convention Center Garage",
                "Open",
                "445",
                "510"
            ],
            "id": "20"
        },
        {
            "cell": [
                "Second San Carlos Garage",
                "Open",
                "184",
                "205"
            ],
            "id": "24"
        }
    ],
    "total": 7
}

Numpy Basics

Numpy is a python library for efficiently dealing with arrays. Under the hood, it can leverage C and Fortran to achieve those efficient array operations.

  • It's important to note that if you want to use numpy for a single element, use np.array([1]) as opposed to np.array(1) or np.uint8(1). Operations on np.uint8 or a scalar np.array (such as np.array(1)) aren't guaranteed to return a numpy data type or to behave properly:
    • In [35]: type(np.array(10000) * 1000000000000000000000000000000)
      Out[35]: int
      
    • In [36]: a = np.array(10000)
      
      In [37]: a *= 1000000000000000000000000000000
      ---------------------------------------------------------------------------
      TypeError                                 Traceback (most recent call last)
       in ()
      ----> 1 a *= 1000000000000000000000000000000
      
      TypeError: ufunc 'multiply' output (typecode 'O') could not be coerced
      to provided output parameter (typecode 'l') according to the casting rule ''same_kind''
      

Although it's also important to remember that, under normal operation, you need to deal with overflow. Depending on your application, overflow can be a desirable thing. Here's an example of overflow:

In [1]: import numpy as np
In [3]: a = np.array([255], dtype=np.uint8)
In [4]: a
Out[4]: array([255], dtype=uint8)
In [5]: a+1
Out[5]: array([0], dtype=uint8)

Instead of 255+1 becoming 256, it became 0, because 255 is the maximum value a uint8 can hold, so when 1 was added to it, all the bits were flipped from 1s to 0s, i.e. from 11111111 to 00000000. uint8: "u" means unsigned, as in no negative numbers; int means integers, as in no decimal places; 8 means 8 bits, as in 8 digits, each of which is either a 0 or a 1.

Internet Security for Everyone

Why you should care: These days, almost everyone uses computers or "smart" phones (or internet-connected toys/refrigerators/thermostats). It's difficult to avoid them. But everyone should know some basic things when using them, so that you don't unwittingly give away your passwords, credit card numbers, or let your computer become a zombie in a botnet.

Security things to remember when using computers:
Read more Internet Security for Everyone