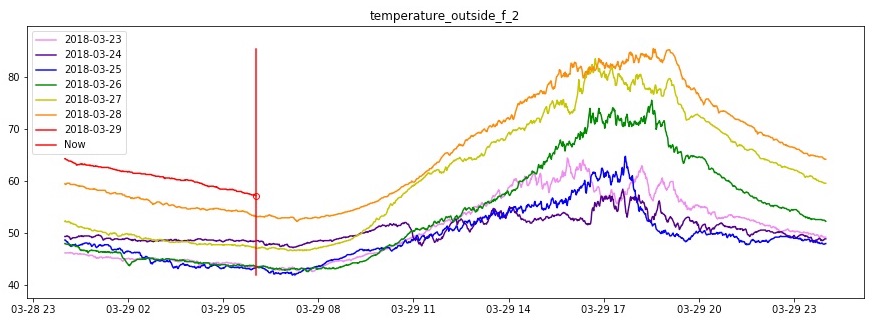
If you know the mnemonic "ROY G BIV" for the rainbow, then this graph should be pretty easy to read. R is red for today, O is orange for yesterday, Y yellow for the day before that, etc (green blue indigo violet). Just start from today and follow your eyes to the left until you reach the border, then mentally pick the next color, then find where that color starts on the right side of the graph. Repeat.
My motivation for this post was that the outside temperature was noticeably higher yesterday than the previous days; it was over 80ºf. I had a feeling my graphs would be pretty interesting - this graph shows that it consistently got warmer each day for the past 3 days.

San Jose, CA outdoor temperature from 2018-03-23 to 2018-03-29.
I haven't seen that on weather sites before! Siri says she can't tell you about past weather.. but that should be even easier than trying to predict the future!